


Gantt Chart
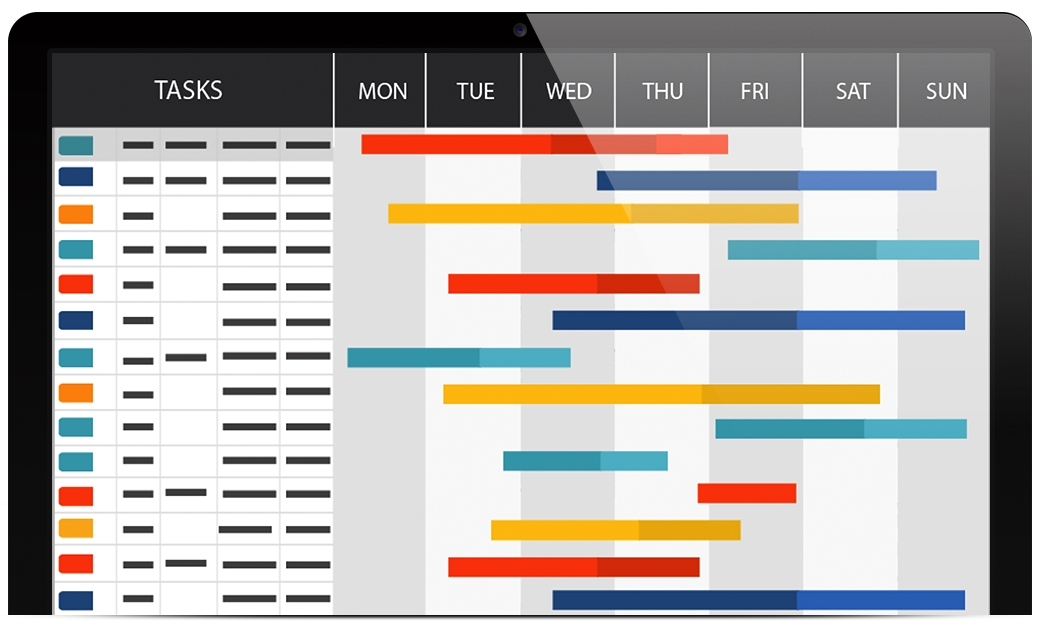
The Gantt chart is a simple and seamless visual representation of a Project Plan. It is graphical representation of the start and end of the terminal and summary elements of the Project. Talygen’s online Gantt chart is fully integrated with Project Management and gives clear graphic illustration of the Project status in horizontal bars. It primarily focuses on the Project plan management with Task dependency and gives you clear picture at single screen about the whole Project. The Gantt chart software clearly shows the order in which the tasks need to be completed. It helps Project Managers become more organized with their Projects management.
Key Features
Task Information
The Project Manager can easily access the Task information from a single screen and can manage Tasks manually too. The PM can quickly add multiple Tasks and create sub-Tasks within a particular time interval.

Resource View
The Project Manager can access details about a particular resource workload. Therefore, Gantt chart online is helpful in checking the availability of the resource.
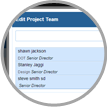
Team Members
The Project Manager can view the listing of Team members and easily manage the Team for a particular Project. The Project Manager can also allocate resources from a single screen.
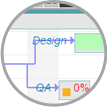
Dependencies
The Project Manager can create dependencies between tasks and can effectively control the work breakdown with Gantt chart creator.
Benefits
- Keep track of scheduled tasks.
- Keeps everything on single screen.
- Effectively helps to understand task relationship or dependency.
- User can efficiently allocate resources.
- Helps to manage Project along with team members.