
- Home
-
Tour ▼
- Project Management
- Ticketing System
- Time Tracking
- CRM
- Asset Management
- Field Service Management
- Employee Monitoring
- Productivity Suite
- Expense Tracker
- Event Management
- Hiring
- Billing And Invoicing
- Performance Review
- Leave Management
- Industries ▼
-
Lets Compare ▼
- 10to8
- 17hats
- Abacus
- Accelevents
- Accelo
- ActiveCollab
- Acuity Scheduling
- ADP TotalSource
- Agile CRM
- AI Field Management
- Anglepoint
- ApplicantStack
- Appointeze
- Appointlet
- Appointy
- Aptean
- Asset Panda
- AssetTiger
- Asset Infinity
- Autotask
- Avaza
- Awork
- BambooHR
- Basecamp
- Big Biller
- BigTime
- Birdview
- Bitrix24
- BiznusSoft
- Bizzabo
- Bonusly
- Bookeo
- Booksy
- Bookwhen
- Box
- BQE
- Breeze
- Bryq
- Bullhorn
- CalendarSpots
- Capsule CRM
- Ceipal
- Certify
- Cheqroom
- Clarizen
- ClearPathGPS
- ClickUp
- Clio
- Clockodo
- Close
- Commusoft
- Concur
- Confluence
- ConnectWise
- CONREGO
- Corpay
- Darwinbox
- DeskTrack
- Dext
- Docuware
- Doodle
- Dovico
- DreamzCMMS
- Dropbox Business
- eFileCabinet
- Egnyte
- eMaint
- Epicor
- EventBrite
- Eventcombo
- EventMobi
- Eventsair
- Eventzilla
- ExpensePath
- ExpensePoint
- Expensify
- EZ Office Inventory
- EZO
- FactorialHR
- FieldEdge
- FieldPulse
- Fiix
- FreshBook
- Freshdesk
- Freshservice
- Freshteam
- Freshworks
- Front
- Furious Squad
- GigaBook
- GigaTrak
- Global Shop Solutions
- GoCodes
- GoFMX
- GoodDay
- Google Drive
- Gusto
- Hardcat
- Halogen Software
- Heeros
- Hive
- Housecall Pro
- HubSpot
- Idrive
- Infraspeak
- InLoox
- Insightly
- InvGate
- Invoicera
- Invoice2go
- Ivanti
- Jane App
- JazzHR
- Jira
- Jobber
- Joblogic
- Jumpshare
- Kantata
- Keap
- Keka
- Kickserv
- Koofr
- Lansweeper
- Limble CMMS
- Livetecs
- Mega
- Microsoft Planner
- Motivosity
- NetSuite
- Nextcloud
- Nextiva
- Nimble
- Odoo
- Okappy
- OrangeHRM
- OnceHub
- OneDrive
- Opendrive
- Paymo
- Pcloud
- Performance Pro
- Pheedloop
- Picktime
- Pipedrive CRM
- Pipefy
- Planning Pod
- Pleo
- Podio
- Pro Workflow
- PurelyHR
- QuickBooks
- Rainfocus
- Ravetree
- Razonsync
- Recruiterflow
- Reftab
- Replicon
- RescueTime
- Rippling
- Rocket Matter
- Rydoo
- Saba Talent
- Sage HR
- Salesforce
- Samepage
- Schedulista
- Scoro
- Service Cloud Software
- Service Fusion
- ServiceNow
- ServiceSight
- Service Trade Commercial
- Setmore
- Sharefile
- SharePoint
- Signinapp
- SimplyBook
- SnapAppointments
- Snipe-IT
- SolarWinds
- Square Appointments
- Stackfield
- Stampli
- STEL Order
- SugarCRM
- SuiteCRM
- SuperSaaS
- Swoogo Events
- Sync
- SyncStream
- Taiga
- Teamgantt
- Teamtailor
- Teamwork
- Time Doctor
- TimeTap
- Tipalti
- Toggl
- Trafft
- Tresorit
- TriNet
- UKG
- UpKeep
- Upland
- Vagaro
- vCita
- vfairs
- Vonage
- Vtiger
- Wasp Barcode
- Webexpenses
- WebHR
- Whova
- Workable
- WORKetc
- Workiz
- Workstatus
- Wrike
- Xero
- XING Events
- YouCanBook
- Zendesk
- Zoho CRM
- Zoho Expense
- Zoho People
- Zoho Projects
- Zoho Recruit
- Zoho Workdrive
- Downloads
- About Us
- Contact
- Blog

- Try for Free
- Pricing & Sign Up
- Live Demo
-

Knowledge Based Article
Gantt Chart
Gantt chart is a simple and seamless visual representation of a project plan. It is graphical representation of the start and end of the terminal and summary elements of the project. The Gantt chart in Talygen gives clear graphic illustration of the project status in horizontal bars.
The Gantt chart clearly shows the order in which the tasks need to be completed. Over all, it helps project managers to become more organized with their project management. To manage the project in Gantt chart follow the below given steps.
 For an instructional demonstration video click here.
1. Go to Full Menu > Project.
2. Click the Gantt Chart icon.
The status of tasks in project is shown in 8 different colors namely:
Green – Active
Blue – Completed
Violet – Failed
Yellow – Suspended
Red – Undefined
Purple – Inactive
Orange – In progress
Brown – Planning
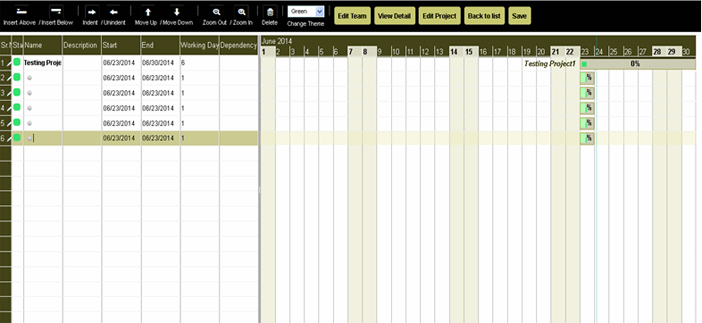
1. As shown in the Figure above - Testing Project1 is the project under which various tasks are created. The users can create multiple tasks and drag them to set the 'Start Date' and 'End Date'.
2. Insert Below and Insert Above - The users can add more task in between by using 'Insert Below' if the task has to be added below, 'Insert Above' if the task has to be created above the particular task.
3. Create Dependencies - Double click upon the task to create dependency. Click on dependency tab and select the task and days for dependency. Then click on 'save'

4. To view task details: click upon the task tab

5. To add the resources, click on the task and select the users.

Plans
Request For Demo Buy NowSocial Links

Office Address
Tour
- Project Management
- Ticketing System
- Time Tracking
- CRM
- Asset Management
- Field Service Management
- Event Management
- Expense Tracker
- Hiring
- Billing and Invoicing
- Appointments Calendar
- Performance Review
- Leave Management
- Screenshot Tracking
- Unified Communication
- Resource Scheduling
- Knowledge Base
- Personalized Dashboard
- Report
- Employee Management
- Client Portal
- Cloud Storage
- Approval Rules & Auditing
- Utility-Billing-Software
- Employee Monitoring
- Productivity Suite
- 3rd Party Integration
- Organization Chart
Other Links
- Pricing & Sign Up
- Testimonials
- Integration
- More Resources
- Recruitment Software
- Online Invoicing Software
- Remote Work Monitoring
- Expense Tracking Software
- FSM Software for Healthcare
- Field Service Management Software
- FSM Software
- Talygen IT Asset Management Software
- Project Management Software For Construction
- IT Asset Management Solutions
- FSM Software For Small Business
- Online Invoicing Software Guide For Small Businesses
- Project Management Software For Construction
- It Infrastructure Managed Services
Support Pages
-
 Rated
4.95/5.0
by
325+
Reviews
Rated
4.95/5.0
by
325+
Reviews